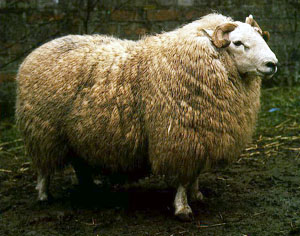
The Golden Fleece of Cheviots of New Zealand
Sheep Shearing is Fun
Region: Balder
Quicksearch Query: Cheviots of New Zealand
|
Quicksearch: | |
NS Economy Mobile Home |
Regions Search |
Cheviots of New Zealand NS Page |
|
| GDP Leaders | Export Leaders | Interesting Places BIG Populations | Most Worked | | Militaristic States | Police States | |

Sheep Shearing is Fun
Region: Balder
Quicksearch Query: Cheviots of New Zealand
| Cheviots of New Zealand Domestic Statistics | |||
|---|---|---|---|
| Government Category: | Golden Fleece | ||
| Government Priority: | Defence | ||
| Economic Rating: | Frightening | ||
| Civil Rights Rating: | Some | ||
| Political Freedoms: | Few | ||
| Income Tax Rate: | 65% | ||
| Consumer Confidence Rate: | 102% | ||
| Worker Enthusiasm Rate: | 101% | ||
| Major Industry: | Arms Manufacturing | ||
| National Animal: | Kiwi | ||
| Cheviots of New Zealand Demographics | |||
| Total Population: | 22,282,000,000 | ||
| Criminals: | 1,490,919,514 | ||
| Elderly, Disabled, & Retirees: | 2,289,351,407 | ||
| Military & Reserves: ? | 1,551,065,506 | ||
| Students and Youth: | 4,506,534,500 | ||
| Unemployed but Able: | 2,755,589,464 | ||
| Working Class: | 9,688,539,609 | ||
| Cheviots of New Zealand Government Budget Details | |||
| Government Budget: | $575,981,958,400,237.88 | ||
| Government Expenditures: | $529,903,401,728,218.88 | ||
| Goverment Waste: | $46,078,556,672,019.00 | ||
| Goverment Efficiency: | 92% | ||
| Cheviots of New Zealand Government Spending Breakdown: | |||
| Administration: | $68,887,442,224,668.45 | 13% | |
| Social Welfare: | $5,299,034,017,282.19 | 1% | |
| Healthcare: | $37,093,238,120,975.33 | 7% | |
| Education: | $68,887,442,224,668.45 | 13% | |
| Religion & Spirituality: | $26,495,170,086,410.95 | 5% | |
| Defense: | $121,877,782,397,490.34 | 23% | |
| Law & Order: | $84,784,544,276,515.02 | 16% | |
| Commerce: | $90,083,578,293,797.22 | 17% | |
| Public Transport: | $10,598,068,034,564.38 | 2% | |
| The Environment: | $0.00 | 0% | |
| Social Equality: | $26,495,170,086,410.95 | 5% | |
| Cheviots of New ZealandWhite Market Economic Statistics ? | |||
| Gross Domestic Product: | $428,074,000,000,000.00 | ||
| GDP Per Capita: | $19,211.65 | ||
| Average Salary Per Employee: | $29,586.63 | ||
| Unemployment Rate: | 9.92% | ||
| Consumption: | $281,921,609,688,678.38 | ||
| Exports: | $102,377,766,780,928.00 | ||
| Imports: | $99,493,789,827,072.00 | ||
| Trade Net: | 2,883,976,953,856.00 | ||
| Cheviots of New Zealand Non Market Statistics ? Evasion, Black Market, Barter & Crime | |||
| Black & Grey Markets Combined: | $1,643,406,805,271,310.50 | ||
| Avg Annual Criminal's Income / Savings: ? | $100,941.15 | ||
| Recovered Product + Fines & Fees: | $197,208,816,632,557.25 | ||
| Black Market & Non Monetary Trade: | |||
| Guns & Weapons: | $99,950,358,489,795.81 | ||
| Drugs and Pharmaceuticals: | $65,946,628,281,927.15 | ||
| Extortion & Blackmail: | $123,649,928,028,613.38 | ||
| Counterfeit Goods: | $183,414,059,909,109.88 | ||
| Trafficking & Intl Sales: | $18,547,489,204,292.01 | ||
| Theft & Disappearance: | $49,459,971,211,445.35 | ||
| Counterfeit Currency & Instruments : | $166,927,402,838,628.09 | ||
| Illegal Mining, Logging, and Hunting : | $4,121,664,267,620.45 | ||
| Basic Necessitites : | $41,216,642,676,204.47 | ||
| School Loan Fraud : | $53,581,635,479,065.80 | ||
| Tax Evasion + Barter Trade : | $706,664,926,266,663.50 | ||
| Cheviots of New Zealand Total Market Statistics ? | |||
| National Currency: | Lamb Chop | ||
| Exchange Rates: | 1 Lamb Chop = $1.29 | ||
| $1 = 0.78 Lamb Chops | |||
| Regional Exchange Rates | |||
| Gross Domestic Product: | $428,074,000,000,000.00 - 21% | ||
| Black & Grey Markets Combined: | $1,643,406,805,271,310.50 - 79% | ||
| Real Total Economy: | $2,071,480,805,271,310.50 | ||
| Balder Economic Statistics & Links | |||
| Gross Regional Product: | $1,346,771,314,458,755,072 | ||
| Region Wide Imports: | $171,174,547,192,545,280 | ||
| Largest Regional GDP: | Nianacio | ||
| Largest Regional Importer: | Nianacio | ||
| Regional Search Functions: | All Balder Nations. | ||
| Regional Nations by GDP | Regional Trading Leaders | |||
| Regional Exchange Rates | WA Members | |||
| Returns to standard Version: | FAQ | About | About | 483,333,061 uses since September 1, 2011. | |
Version 3.69 HTML4. V 0.7 is HTML1. |
Like our Calculator? Tell your friends for us... |